Input: NCBI GenBank records or user's own genome sequences in GenBank format
Clustering: DIAMOND + MCL + phylogeny-based post-processing

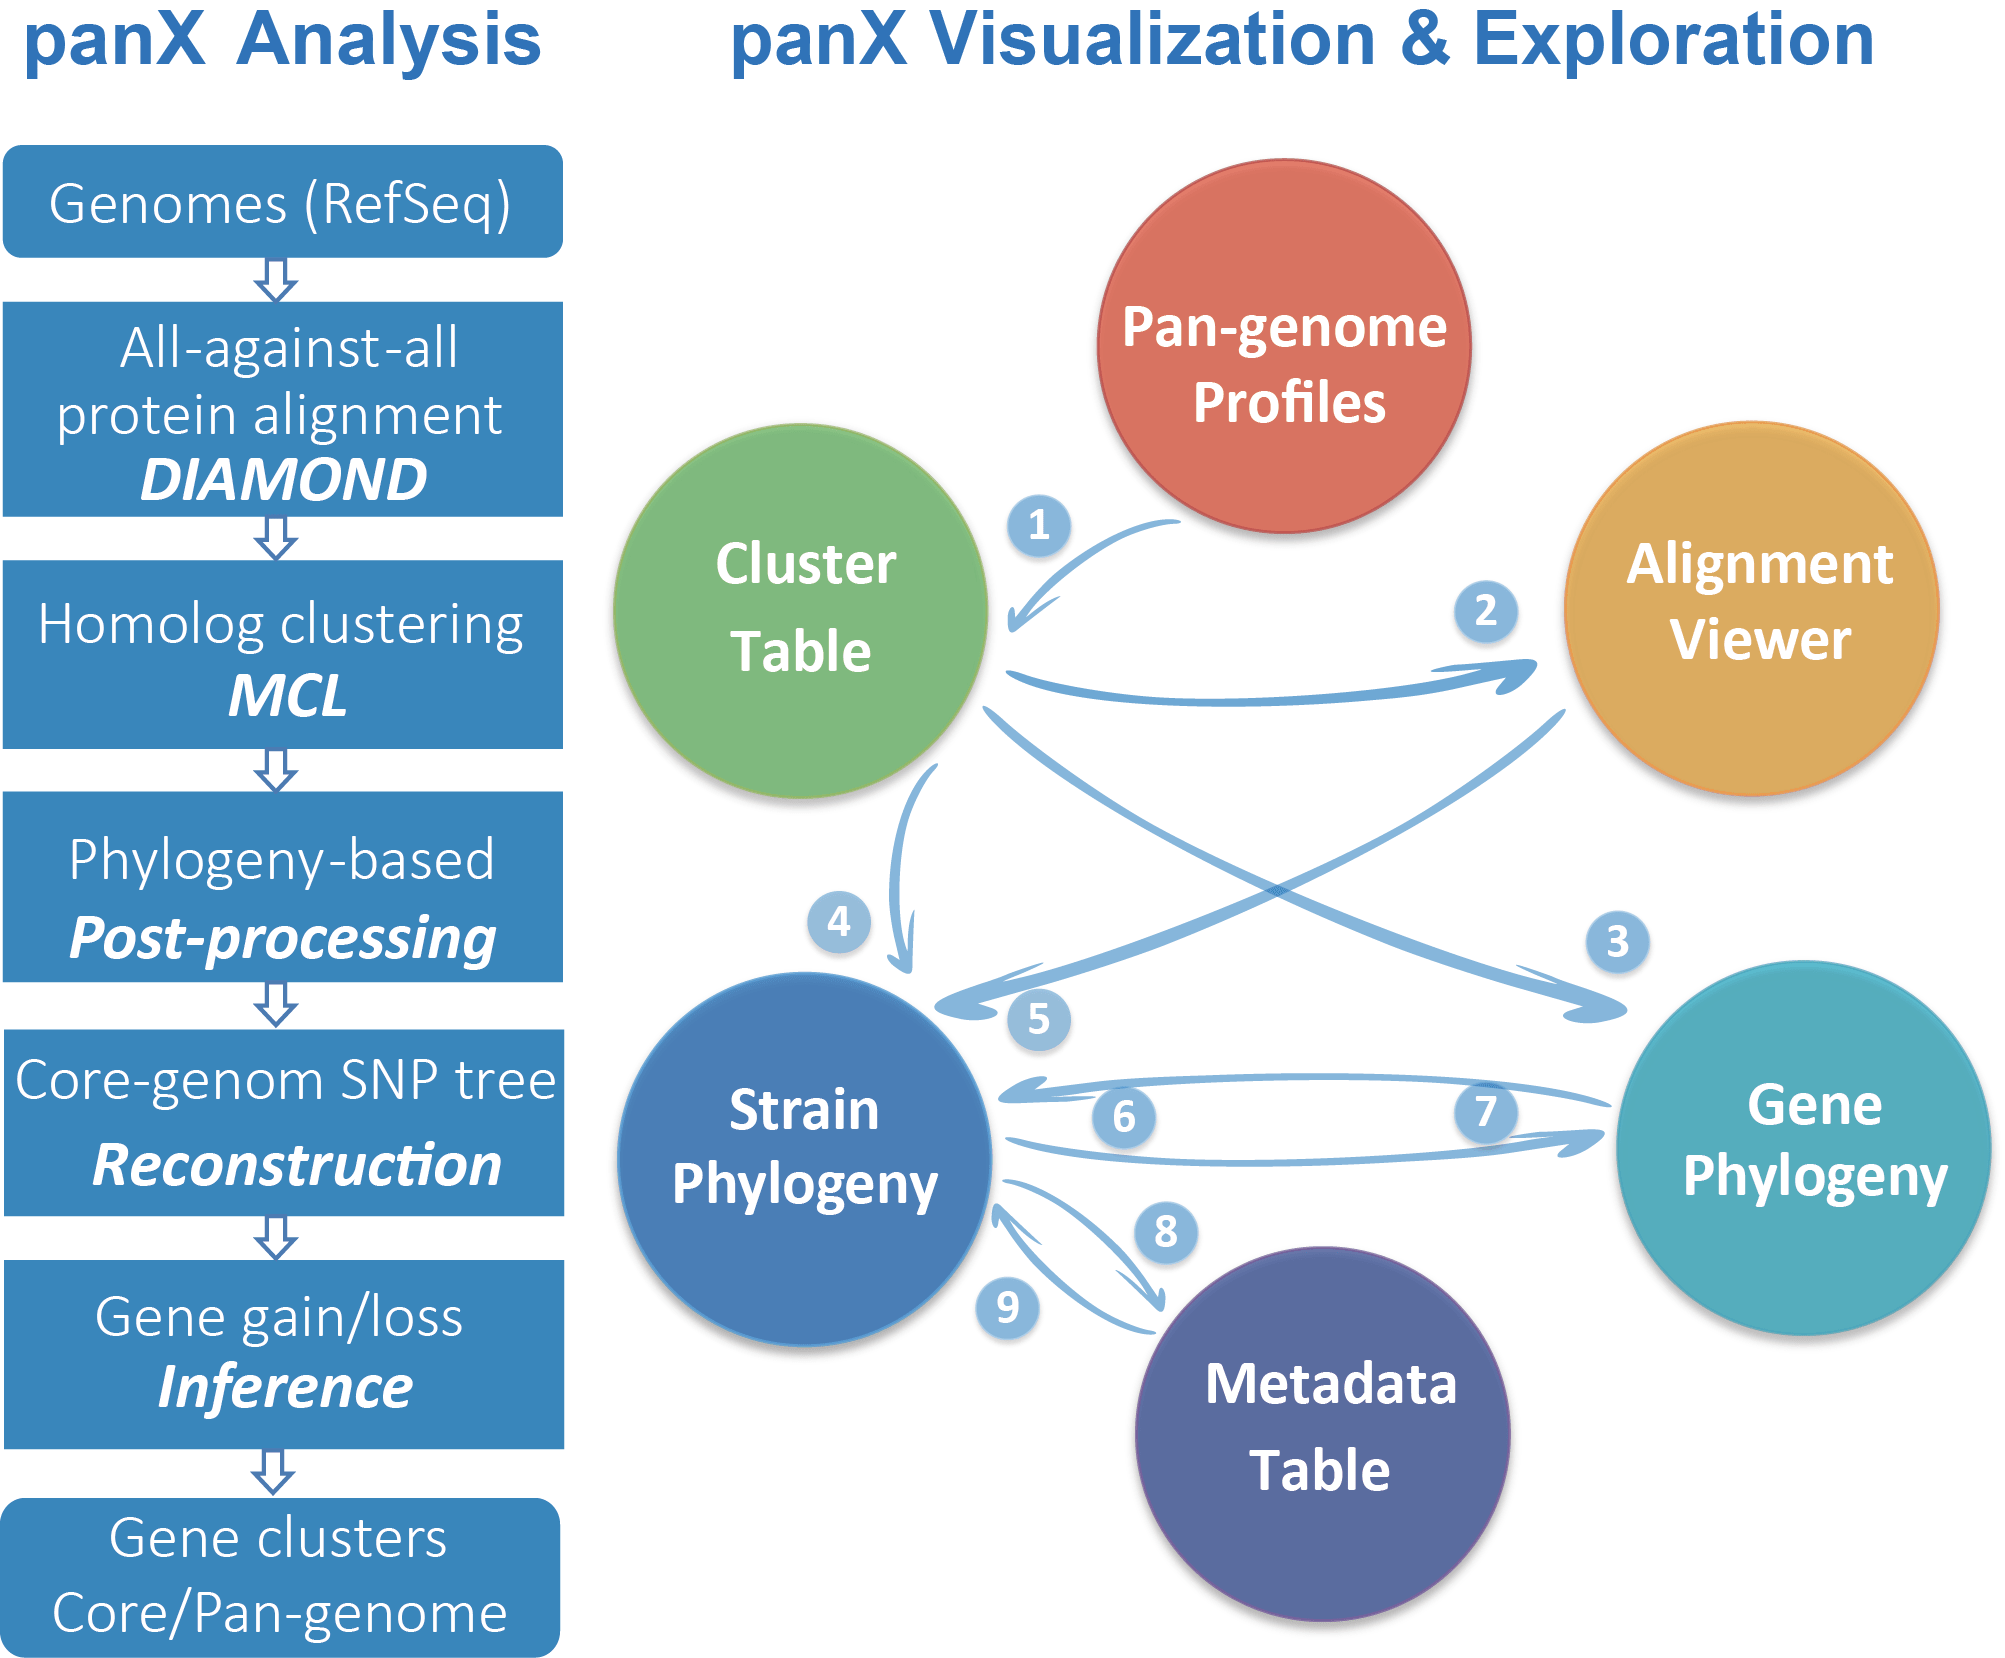
Fig.1 An overview of pan-genome analysis and visualization pipeline.
PanX analysis pipeline is based on DIAMOND, MCL and phylogeny-aware post-processing to determine clusters of orthologous genes from a collection of annotated genomes. PanX generates a strain/species tree based on core genome SNPs and a gene tree for each gene cluster.
PanX interactive visualization:
(1) The dynamic pan-genome statistical charts allow rapid filtering and selection of gene subsets in the gene cluster table;
clicking a gene cluster in the cluster table loads (2) corresponding alignment, (3) individual gene tree and (4) gene presence/absence and gain/loss pattern on strain/species tree;
(5) Selecting sequences in alignment highlights associated strains on strain/species tree;
(6) (7) Strain/species tree interacts with gene tree in various ways;
(8) Zooming into a clade on strain/species tree screens strains in metadata table;
(9) Searching in metadata table display strains associated with specific meta-information.
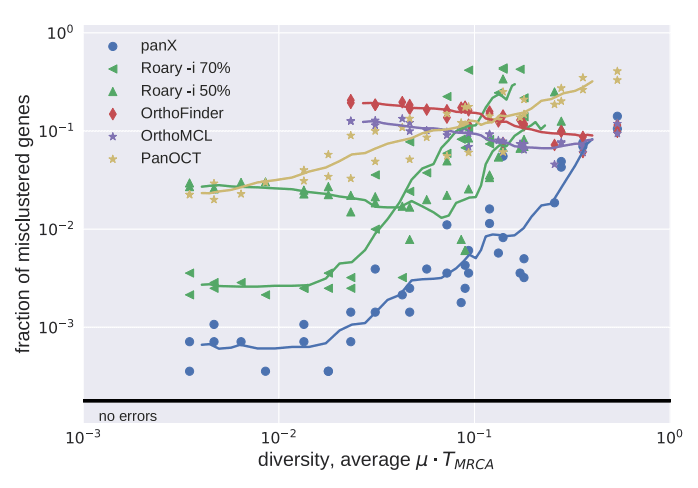
Simulated datasets

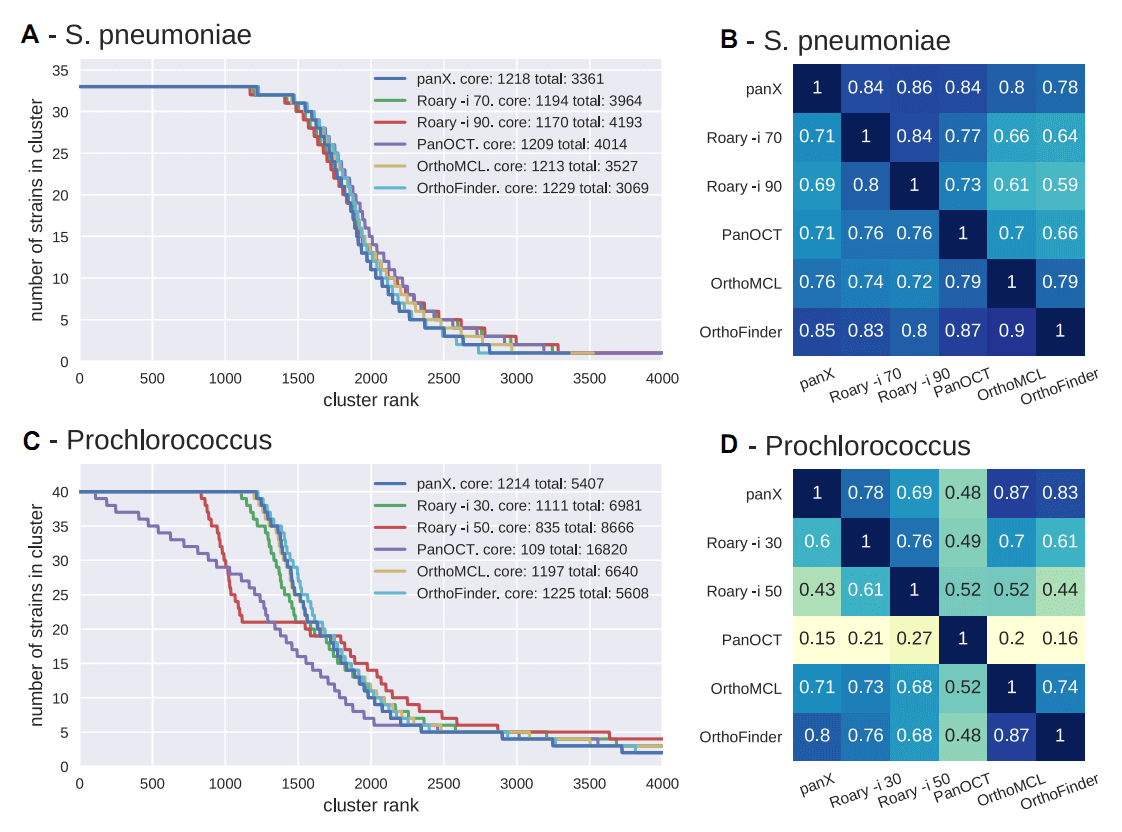
Real datasets
